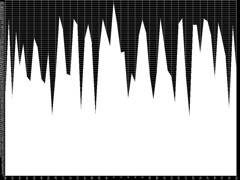
Odometry Graph
I find when working with data that a picture paints a thousand words. Having taken the fairly meaningless data from the odometry sensors for the wheels, it starts to make sense once plotted onto a graph. Here's the code:
# (C)2006 Matt (http://www.andomonir.org.uk)
# Released under the GPL v2 Licence
#!/usr/bin/env python

from serial import *
from gdchart import *
ser = Serial()
ser.setPort("/dev/ttyS0")
ser.setStopbits(1)
ser.setParity('N')
ser.setBaudrate(2400)
ser.open()
firsttime=0;
datastore=dict()
item=0;
try:
 while 1:
        reading=ser.read(20)
     reading2=reading[:14]
        Itemlist = reading2.split(': ', 2)
        temps = Itemlist[1]
        temp = int(temps.strip())
        datastore[str(item)]=temp
        item=item+1

except KeyboardInterrupt:
   print datastore
   x  = _ chart(GDC_AREA,(1024,768),"graph.png",datastore.keys(),datastore.values())
   ser.close()
posted by The Crusty Old Grognard at 5:47 PM
![]()
![]()

0 Comments:
Post a Comment
<< Home